

SHG FROG
Basic Principle
Invented in the 1990’s, the frequency-resolved optical gating (FROG) technique can completely measure ultrashort pulses; in other words, it can measure the intensity and the phase of pulses in both the time and spectral domains. Although FROG has a number of geometries, the SHG FROG geometry is the most widely used for measuring pulses because of its simplicity. In addition, as it uses second harmonic generation, its operation of the SHG FROG geometry requires much less pulse energy.
Figure 1 presents a schematic of the typical SHG FROG, which is similar to that of the intensity autocorrelation. It differs, however, for after receiving a signal from the SHG crystal, the signal is sent to a spectrometer instead of a photo-detector.
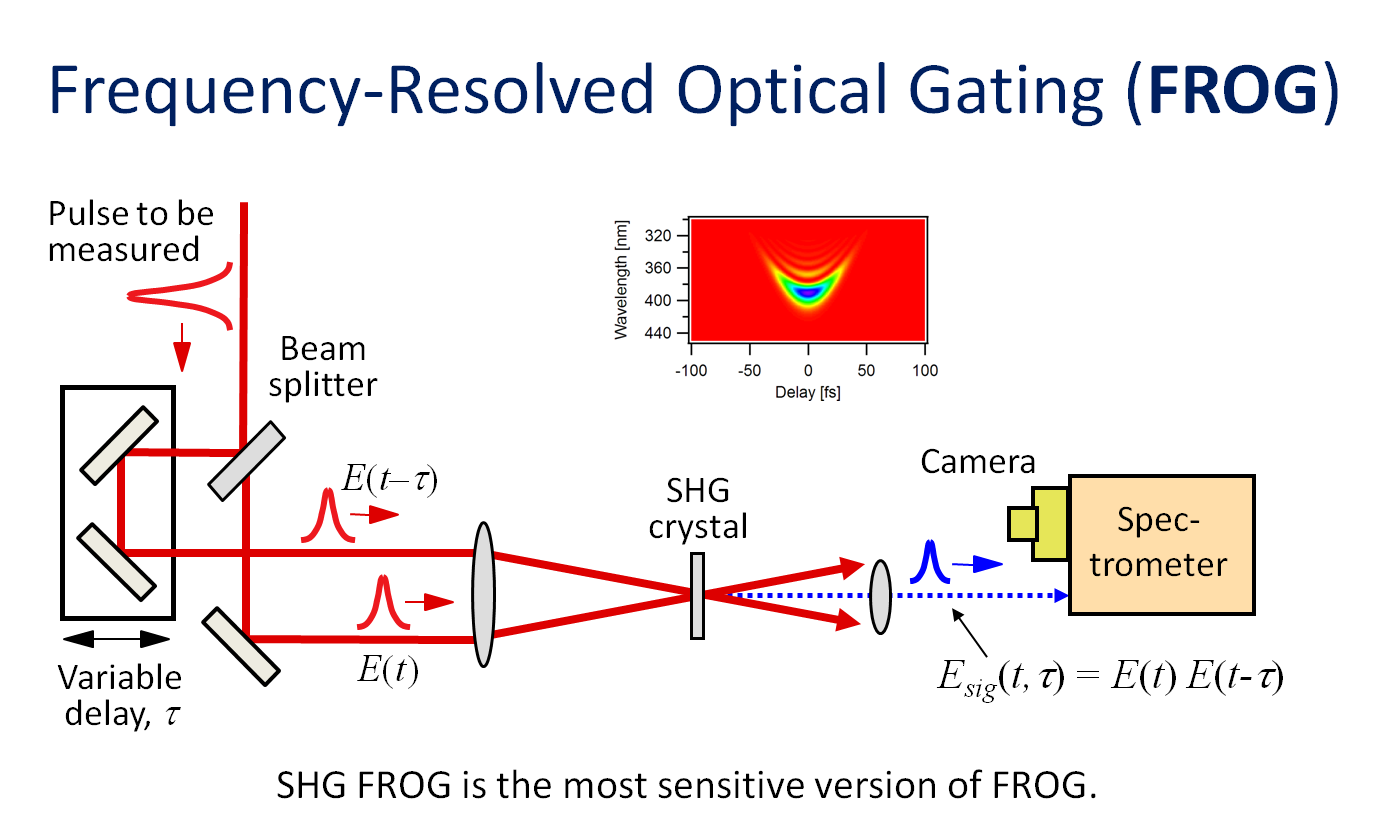
Figure 1: The schematic of SHG FROG. Similar to the SHG intensity autocorrelator, the SHG FROG has a beam splitter that creates two replicas of the pulse to be measured. The variable delay moving stage can control the delay between the two replicas. If the replicas overlap in the SHG crystal, they generate signals. Afterwards, however, the signal is sent to a spectrometer to obtain a spectrally resolved trace. The insert shows a trace generated from a chirped pulse. Note that the x-axis represents delay and the y-axis wavelength.
As in autocorrelation, the delay between two replicas is controlled by a variable moving stage. A computer records the spectrum for each delay. Note that each one is a spectrum of the sum frequency generated by two replica pulses. After the variable moving stage scans the full delay range, a spectrogram, or FROG trace, is generated. The FROG trace is shown in the insert of Figure 1. Figure 2 shows how to obtain a spectrogram, or FROG trace.
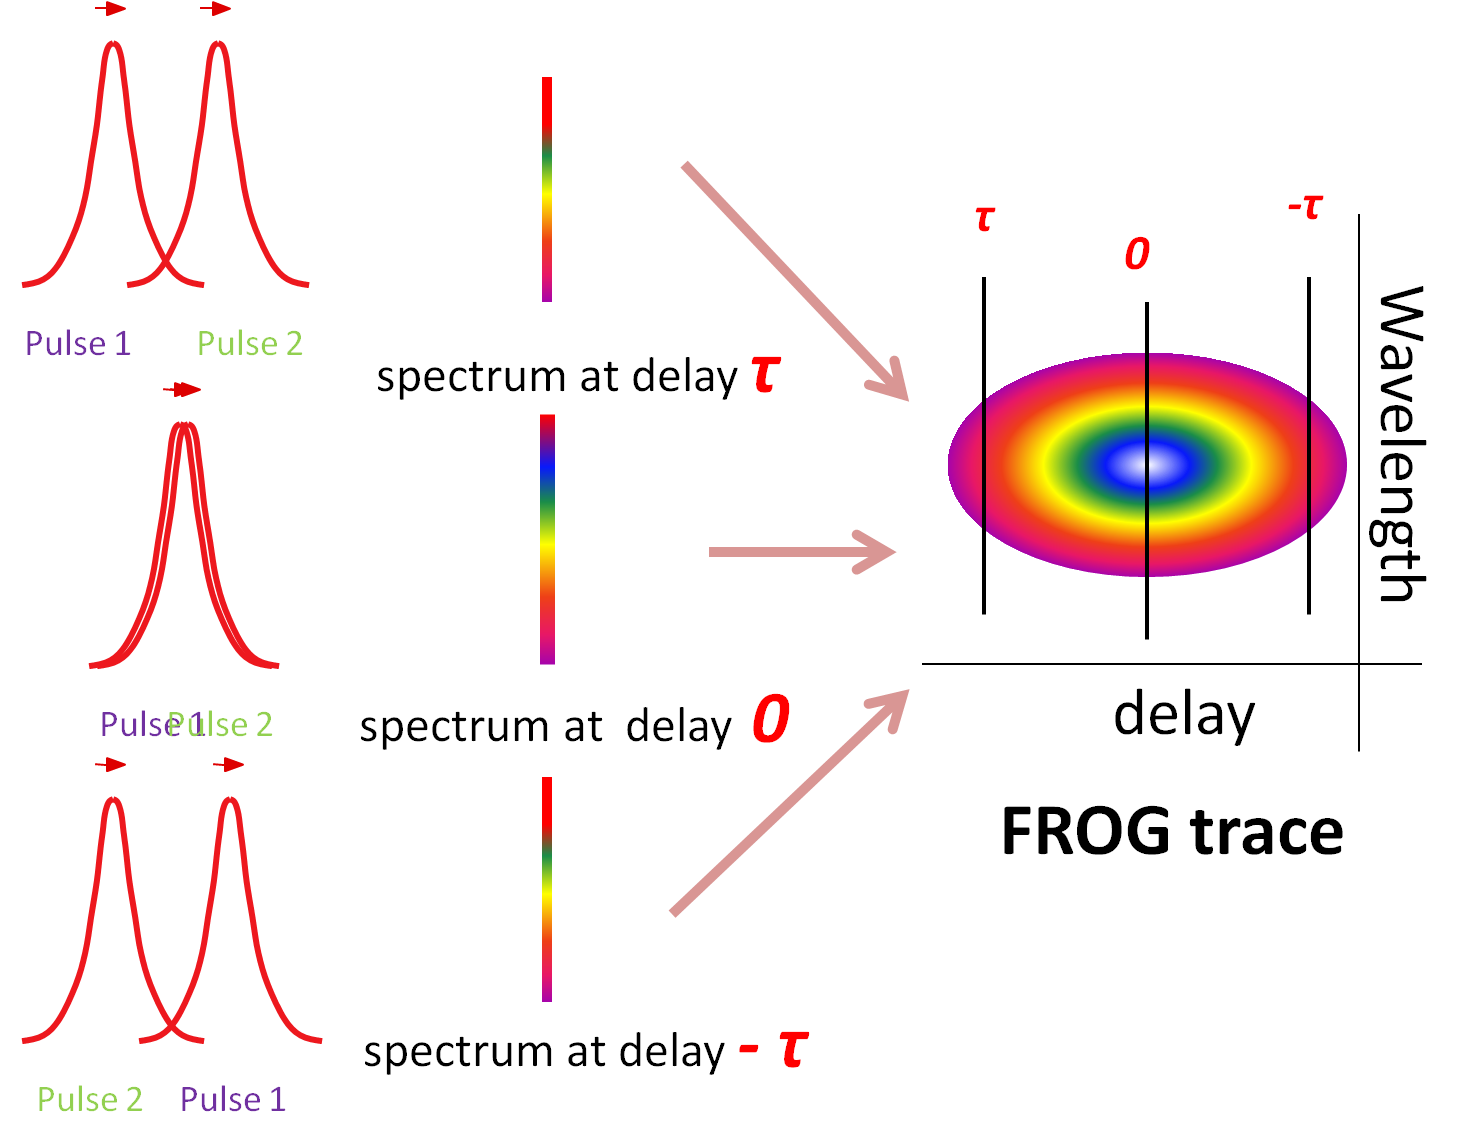
Figure 2: A diagram of how to obtain a FROG trace. A computer records the spectrum for each delay while the variable moving stage moves. After summing all the spectra as a function of the delay, a spectrogram, or FROG trace, is generated. The vertical axis is the wavelength and the horizontal axis the delay. If a pulse has a flat phase, that is, a transform limited pulse, all the spectra should be the same; when the absolute of the delay is large, the relative intensity is lower. As a result, the trace has an elliptical shape.
Once we obtain a FROG trace, we can use an iterative phase retrieval algorithm to reconstruct the intensity and phase of the pulse. In general, the algorithm starts with a Gaussian intensity with a random phase and then it repeats the process until it reaches a solution. Figure 3 illustrates the process of generalized projections, <>a phase retrieval algorithm. The algorithm projects a set of theoretical solutions from an initial guess, a Gaussian intensity with a random phase, that satisfy nonlinear optical constraints. Then the algorithm projects a set of experimental solutions that approach a final solution. The algorithm repeats the process until it obtains the solution that satisfies both constraints, a set of theoretical solutions and a set of experimental solutions.
As the recorded data are substantially redundant, the FROG retrieval algorithm not only delivers the pulse shape but also carries out a consistency check, which is noticeable when errors occur. Errors can result from faulty calibration of the spectrometer or the temporal step. With a newly developed FROG, we are able to calculate pulses in less than one second; therefore, real-time monitoring of a pulse is possible with a FROG device.
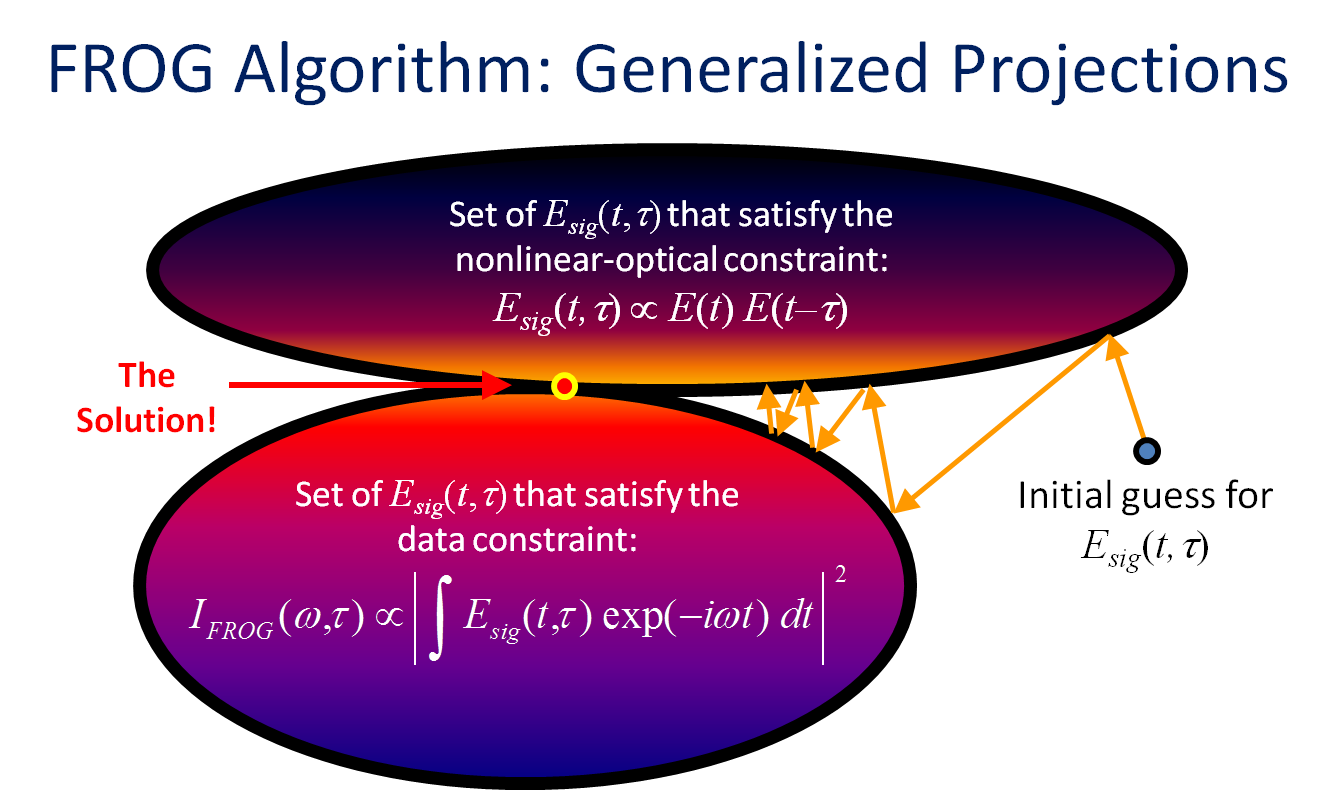
Figure 3: Schematic of generalized projections. The algorithm begins by making an initial guess, which, in general, is a Gaussian intensity with a random phase. The algorithm projects a set of theoretical solutions that satisfy nonlinear optical constraints from the theoretical calculations. Then the algorithm projects a set of solutions from the experimental data constraints and then repeats the process until the intensity and phase of the pulse satisfies both constraints, which represents the solution.
Advantages of FROG
Like autocorrelation, SHG FROG produces a signal at twice the frequency of the input pulse and the spectrometer measures the spectrum of the doubled frequency; therefore, it does not require a fast detector to measure short pulses. Therefore, a normal CCD camera instead of an IR camera can measure pulses in the near IR or IR range. Unlike autocorrelation, the FROG technique can completely measure ultrashort pulses without an assumption of the pulse shape. Therefore, FROG can reveal the structures of pulses. As the process is a highly nonlinear and occurs in a small area, pulses from a fiber laser might be complicated, or when a new pulse laser system is developed, the pulse could be complicated in the beginning. In such cases, FROG is an optimal, ideal technique for identifying structures and optimizing the laser system. Figure 4 shows a typical FROG trace from a fiber laser system, a commercial product in the market. As the pulse is complicated, it should be further optimized.
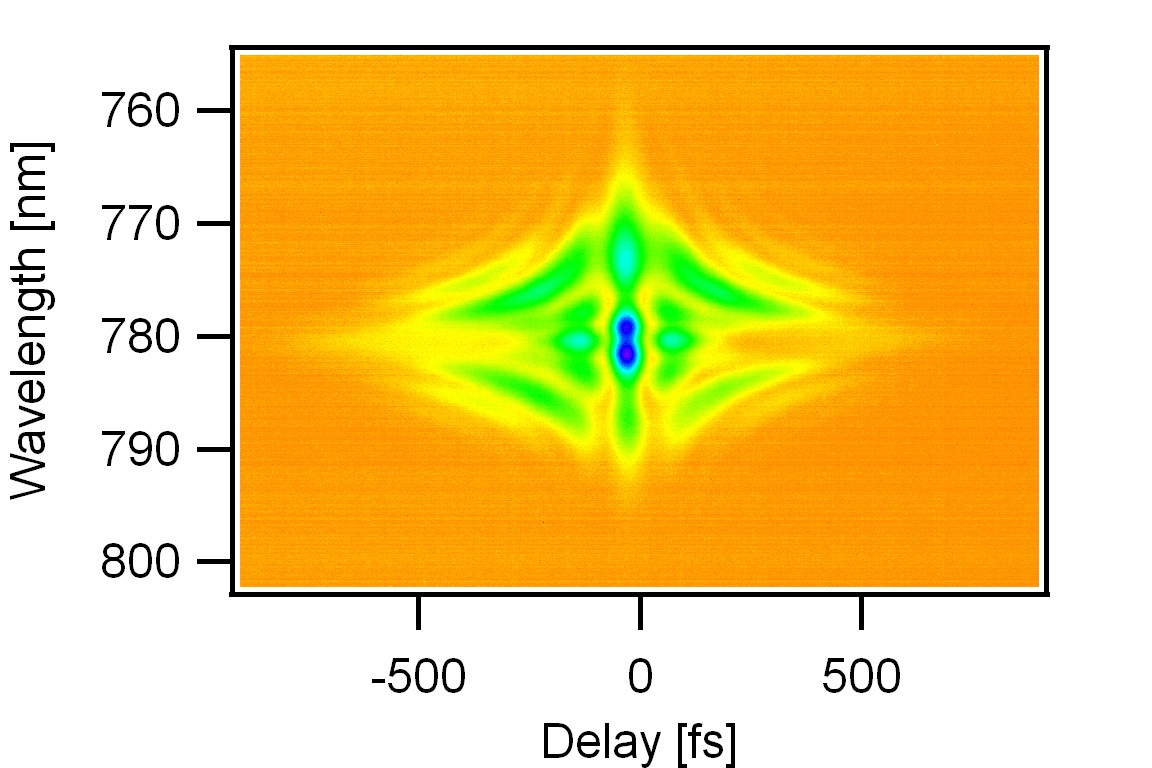
Figure 4: A measured (experimentally) SHG FROG trace from a commercial fiber laser system. While propagating in the optical fiber, the pulse suffers from high-order temporal chirp. In this case, the pulse could have more than three distinguished peaks in the time domain.