

TG FROG for UV
Basic Principle
Unlike SHG FROG, TG FROG (i.e., transient grating FROG) uses third-order nonlinearity. As a result, the signal field in TG FROG is the same as that of the input pulse. Hence, the technique is useful for measuring UV pulses with an inexpensive UV CCD camera. (If we use SHG FROG, the signal frequency is double that of the input pulse, the UV pulse; that is, we must use a camera with sensitivity in the EUV (extreme UV) range, which is quite expensive.) A TG FROG trace is mathematically equivalent to polarization gate (PG) FROG or self-diffraction (SD) FROG SD. In addition, like SHG FROG, TG FROG is a highly intuitive version of FROG, with no ambiguity in time. The TG beam geometry, however, is also the most complex, requiring splitting the pulse into three pulses. Even more complex is that the three pulses need to completely overlap in space and time to generate a transient grating (TG) FROG signal in a χ (3) medium. That is, if a TG FROG is desired, the diffracted four-wave-mixing output pulse must then be spectrally resolved vs. delay. (Figure 1)
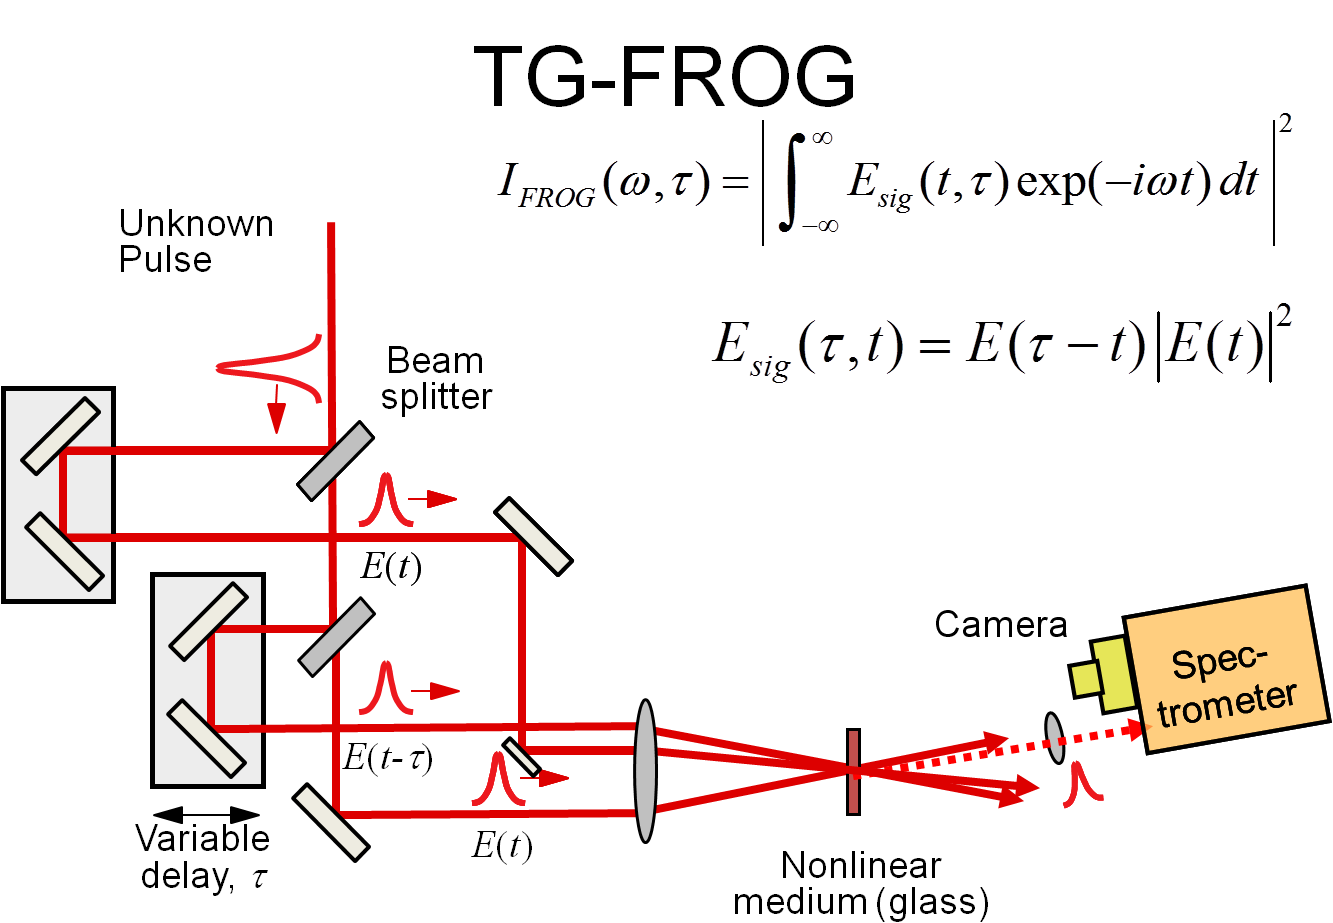
Figure 1: Schematic of a TG FROG apparatus. TG FROG has a three-beam geometry, requiring that the input pulse be split into three replicas. Two of the pulses overlap in time and space in the optical-Kerr medium, producing refractive-index grating. The third pulse, which is variably delayed and overlaps in the fused silica, is diffracted by the induced grating, producing a signal pulse. Depending on which pulse is variably delayed, the TG FROG trace is mathematically equivalent to that of PG FROG or SD FROG.
Second-harmonic generation (SHG), the basis of most pulse measurement techniques including autocorrelation, has a stringent phase-matching requirement, so, even with angle-tuning, SHG-based devices can operate over only a few hundred nm in the near-IR, and less in the visible, much less in UV, and they require angle-tuning when the wavelength is tuned. When measuring short pulses of less than 10fs with a more than 200nm bandwidth in even the near IR, the stringent phase-matching condition can ruin FROG traces. Fig. 2 shows the phase-matching efficiency of a BBO crystal cut for 800nm. Even though the crystal is extremely thin, 20um, it is not able to cover the bandwidth of the 12 fs pulses. With the knowledge that FROG traces are 2-D intensity profiles in the delay and wavelength axes, SH (second harmonic) conversion efficiency becomes crucial to the acquisition of a reasonable FROG trace because lower SH conversion efficiency generates a weaker part of a FROG trace. Unfortunately, because the intensity of the FROG trace is proportional to the square of the phase-matching efficiency, the decrease in intensity in the part of the FROG trace with a lower phase-matching efficiency poses a serious problem. Even if one accounts for the redundancy of the FROG algorithm, differences in the SH efficiency should be less than 30% in the range of the entire bandwidth of the measured pulse to ensure precision of the measurement. (Redundancy: A FROG trace is a time -frequency plot with NxN array points, which is used for determining N intensity points and N phase points, that is, 2N points; there is significant over-determination of the pulse intensity and phase.) In other words, if the crystal is cut for a certain wavelength, the minimum efficiency should be more than 70%. If the pulse is shorter or if it has a large bandwidth, this problem is much more serious. Note that BBO is the best commercially available SHG crystal, for pulses with a center wavelength of 800nm, indicating that the crystal BBO can cover the widest bandwidth of the pulse at 800nm. In addition, using an extremely thin crystal triggers a well-known practical issue. If the thickness of the crystal is ~ several tens of µm or less, the surface condition of the crystal is extremely critical. This is not practical and makes the price of the crystal very expensive. It is inevitable that the polishing process will result in some scratches and dips on the surface of a crystal, but if the crystal is thick enough and if depth of the scratches or dips is not comparable to its entire thickness, they are not a problem. On the other hand, if the crystal is extremely thin, which means that depth of the scratches or dips is comparable to the thickness of the crystal, the dips and scratches create serious problems because they affect the integrity of the FROG traces. The structure of the SH crystal shown in Fig. 2 generates and amplifies the structures of the signal beam, when generating a FROG trace. When measuring pulses in the visible range, the situation worsens. Pulses in the visible range, which are more dispersive for all SHG crystals, require a much thinner crystal that covers the spectral bandwidth of the pulses. Even though the pulse is not that short (~50fs) in the visible range, the crystal manufacturing issue occurs. This kind of pulse, less than 12 fs in the near IR range, or a pulse in the visible range necessitates a new method that avoids the stringent phase-matching condition. Note that if the pulse is long and/or the bandwidth of the pulse is narrow, the crystal can be made to cover the bandwidth of the pulses, so the effect is negligible. In addition, the redundancy of the FROG algorithm can compensate for it.
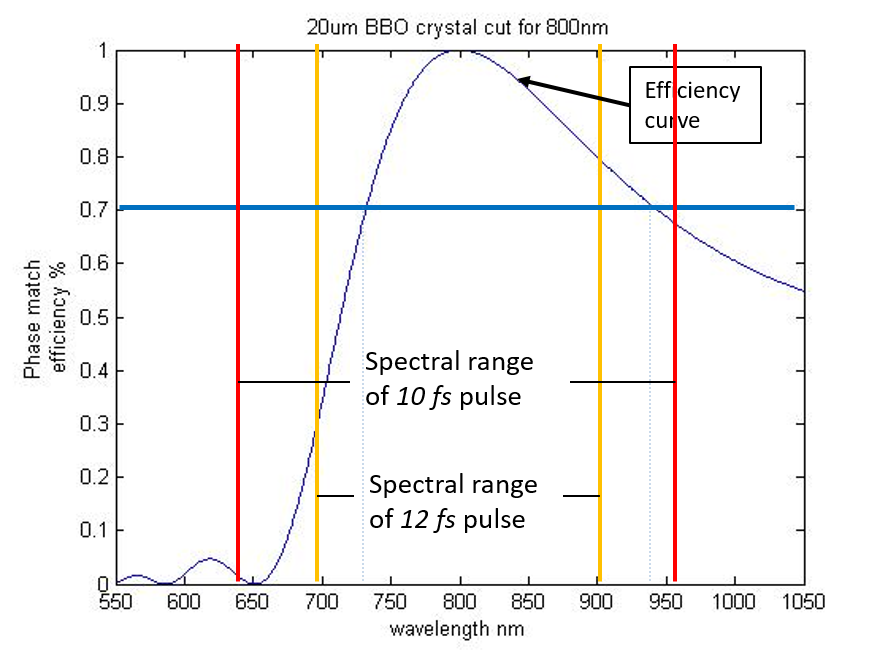
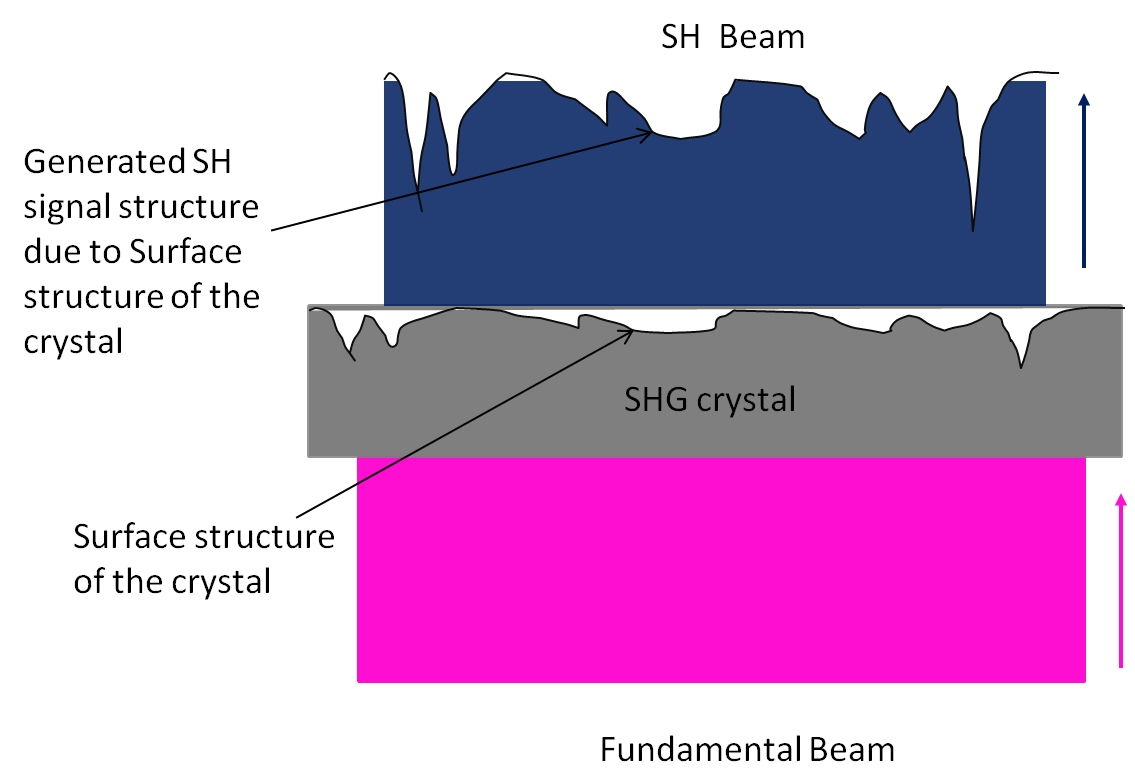
Figure 2: On the left, the phase-matching efficiency is shown for a 20µm thick BBO crystal. Even though the extremely thin BBO crystal is employed for SHG FROG, the crystal is unable to cover the bandwidth of 10 fs pulses. For example, 12 fs at 800nm has ~70nm FWHM. With the head and tail, the spectral width is ~200nm, which spans from 700nm to 900nm. The 20µm thick BBO crystal cannot phase-match less than 730nm wavelengths apart. When accounting for the redundancy of the FROG algorithm, the efficiency should be more than 70%. If the pulse is shorter or if it has a large bandwidth, this problem is much more serious. The right side of the figure shows how the structures of SH signal intensity are generated by an extremely thin crystal. When manufacturing extremely thin crystals of less than 20 µm, ~µm scale surface structures are inevitable. If the thickness of the crystal is more than 100 µm, ~µm scale surface structures should be negligible, but if the fluctuation of the crystal thickness is 10-20%, the crystal can generate some structures on the SH signal intensity. Note that the FROG trace intensity is proportional to the square of the thickness of the crystal. Thus, the SHG FROG geometry is not suitable for measuring short pulses in the visible or near IR range.
As the TG FROG process, however, is automatically phase-matched, no issues arise as they do in the SHG FROG. In other words, it does not create either wavelength-dependent inefficiency in FROG traces or a manufacturing nonlinear material issue.
In summary
TG FROG is the best fit for measuring UV pulses. In addition, for very short pulses in the near IR or IR ranges, SHG FROG creates many issues. To avoid them, we need to use TG FROG geometry instead of SHG FROG geometry.
AFT can provide a simple version of TG FROG. Please see below. For more information, please contact us. Nevertheless, because it uses so many materials and it is not suitable for measuring short pulses, the use of the TG FROG geometry below is limited. AFT can provide another simple version of TG FROG for measuring short pulses in the UV range and shorter pulses in the near IR range. If you wish to do so, please contact us for more information.
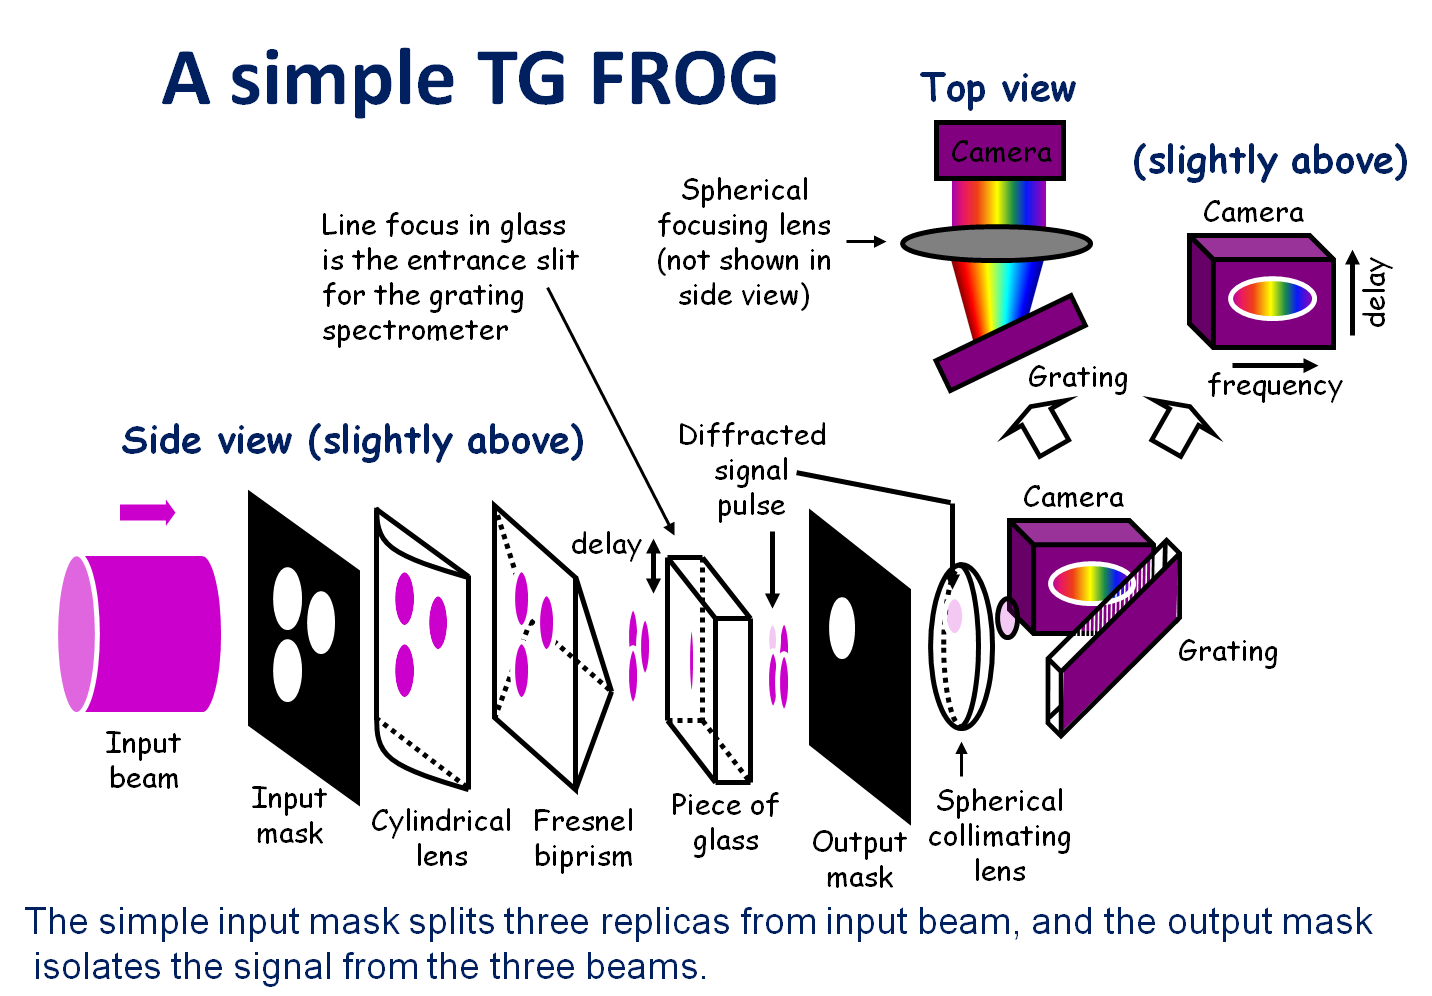
Figure 3: The diagram is from a publication by Dongjoo Lee, “Experimentally simple, extremely broadband transient-grating frequency-resolved-optical-gating arrangement,” in Optics Express, 2006. The diagram shows a schematic of a simple version of TG FROG using a mask.